
By Dr. Ned Gandevani
The recent market volatility has led many investors to consider whether they are better off to stay on the sidelines. The stock market has exhibited wild daily swings. A sharp down day followed by a strong up day or vice versa in the recent months. On the day of writing this article (May 10, 2016), According to CNBC, the Dow Jones Index rose 223.46 points or 1.26% and S&P500 Index moved up 25.70 points for 1.25%. Investors are searching for possible answers and causes to justify the surprise upside move. In the following paragraphs, I have utilized some charts to highlight the current market conditions, which exposes investors to an asymmetric risk. Investors may consider investing in individual stocks rather than the stock market as a whole. The current market risk characteristics encourages investors to be stock pickers rather than passively investing in the market.
Strong market volatility is typically observed at turning points before the market moves up further for a new high or moves down to make a correction. Buyers seek to prove their bullish sentiment while sellers strive to prove them wrong. Often Market volatility is due to lack of clear sentiment on market valuation. Market Multiples or valuation ratios are among valuation methods which help investors to determine relative valuation, to invest in a security, or sell an existing position. Price to Earnings or P/E is a popular ratio used to ascertain whether the market is overbought or oversold. Earnings in the ratio are based on accounting profit, which takes into consideration explicit costs only as opposed to economic profit, which considers implicit costs. Per generally accepted accounting principles (GAAP), reported earnings, net income after taxes, could be manipulated due to the earning management by CEOs. Management is motivated or pressured to be WISE to use any of the following tools to manage the earnings; Window Dressing, Internal Targets, Income Smoothing, and External Expectations. In other words, management can manipulate financial statements for better executive compensation, to meet established performance expectations, and maximize their personal compensation. Accrual accounting principles like inventory costing system and depreciation methods are among the accounting principles, which allows subjective estimate and judgment calls to influence earnings.
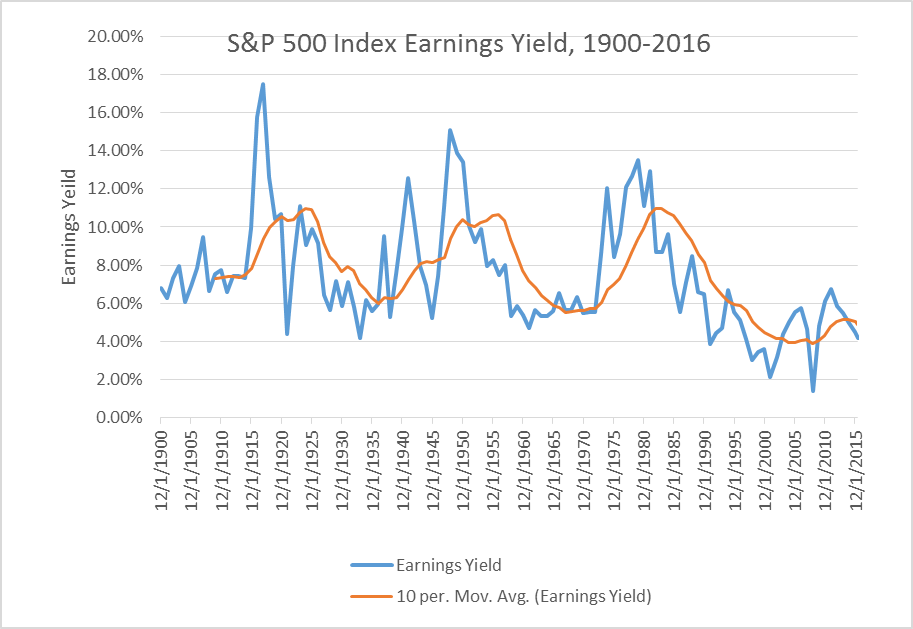
Figure 1 – Historical S&P Index Earnings Yield (Data source: multpl.com)
Converting P/E to E/P, which is the earning yield, allows analysts to study the current market condition and compare it with other types of yields historical performance. The Earnings Yield (E/P) for the S&P index has been going down as depicted on Figure 1. Utilizing the published data to generate Earnings Yield for the S&P Index, the highest yield recorded was on December 31, 1917 for 17.48%, then lower highs on 1948 at 15.11%, and 1979 at 13.53%. Since then, it has been dropping and now registered at 4.2% on 5/9/2016. The 10-year Moving Average, a technical indicator to smooth the data points, does not depict a positive view either. As shown in Figure 1, the Earnings Yield is below the moving average, which is a bearish reading signaling further downward move. In fact, since 2011, the market has experienced an “earnings recession,” as each year the earnings have fallen below the prior year.
Surprisingly, the earnings recession has occurred in light of a low cost of capital, which provides the opportunities for companies to borrow at historical low interest rates for capital expenditures and expansion for better earnings.
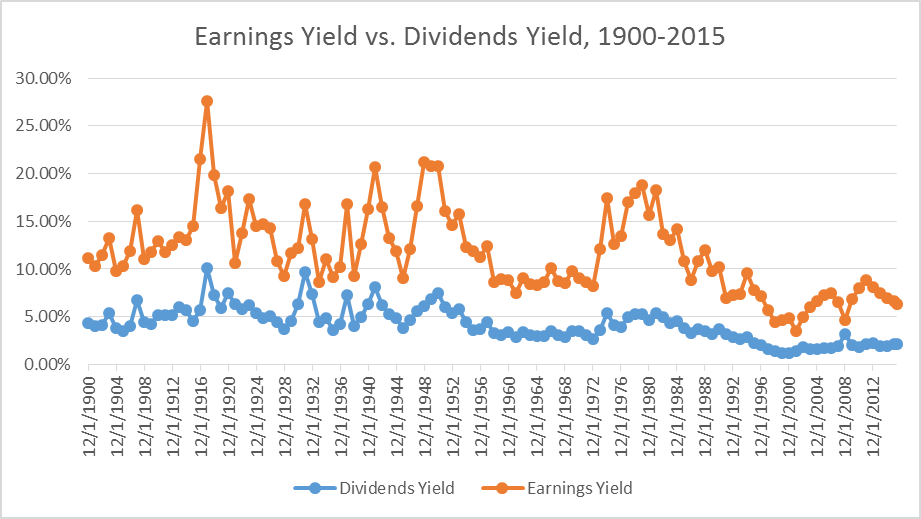
Figure 2 – Historical charts for S&P Index Earnings Yield and Dividends Yield. (Data source: multpl.com)
Comparing earnings yield with the dividend yield for the S&P Index, should shed more light on the earnings weakness. According to the date retrieved from multpl.com, Dividend yields have had a downtrend move, as well since its historical high in 1917 at 10.15% and a lower high for 9.72% in 1931. However, for the past 20 years, the dividend yield for the index has been around 2% or so with an estimated reading for 2.13% on May 9, 2016.
As illustrated in Figure 2, the spread between Earnings Yield and Dividend Yield is about 1.97%. Considering the dividend paying stocks is a main asset in fixed income portfolio, to have a low spread indicates investors for common stocks are taking more risk without proper compensation. In other words, investors are exposed to an asymmetric risk by investing in the stock market.
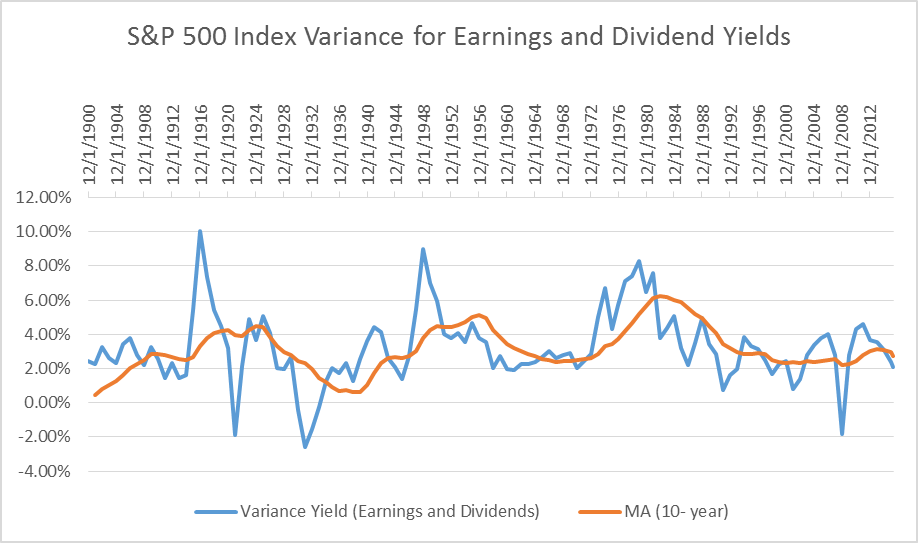
Figure 3 – The annual variance between earnings yield and dividend yield since for the S&P Index since 1900. (Data source: multpl.com)
Figure 3 depicts the historical annual variance between earnings yield and dividend yield as it made a double top chart formation between 2006, 2011, and now dipping under 10-year moving average. Technical analysts consider the chart pattern as a bearish signal, which signals further narrower spread between the two yields. This confirms the earlier assertion that stock market has become riskier due to its asymmetric risk exposure.
Additionally, the dividend yield narrative does not support a strong bull market. Consider Figure 4, which portrays the historical dividends yields for the S&P index with a 10-year moving average. The dividend yield is kissing the moving average with a potential upward move. An increase in dividend yield indicates the bearishness of the market, since companies need to offer higher dividends to entice investors. It could also signal lower price for the stocks.
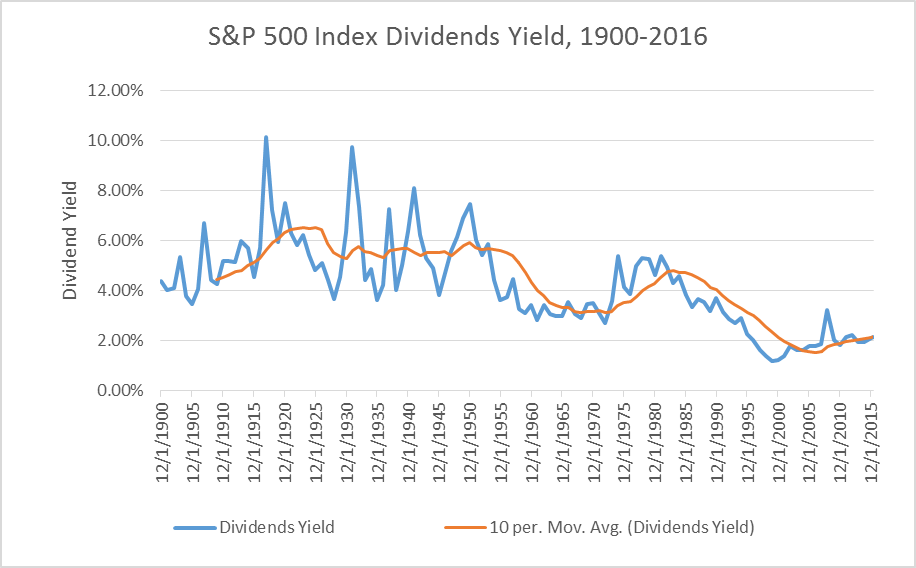
Figure 4 – Historical Dividend Yield for S&P 500 Index with a 10-period Moving Average. (Data source: multpl.com)
Price to Sales (P/S) and Price to Book Value (P/B) are two additional market multiples for stock valuation. If earning is exposed to management discretion and manipulation, there is less chance for sells and book value to be managed. Observing the historical charts for P/S and P/B could reveal some valuable information on the current stock market brittle condition. Consider Figure 5, which shows the historical charts for P/S and P/B dating back to 1999. According to the data retrieved from multpl.com, since 2009, both charts have been edging up, which indicates higher price or lower sales and book value. The estimated reading for P/S at 1.83 on May 9, 2016 is higher than 1.77 measured for December 31, 2000. However, P/B is almost at the same level as it was on 2002. Accordingly, the 15-year readings on P/S and P/B signal a bearish outlook for the stock market.
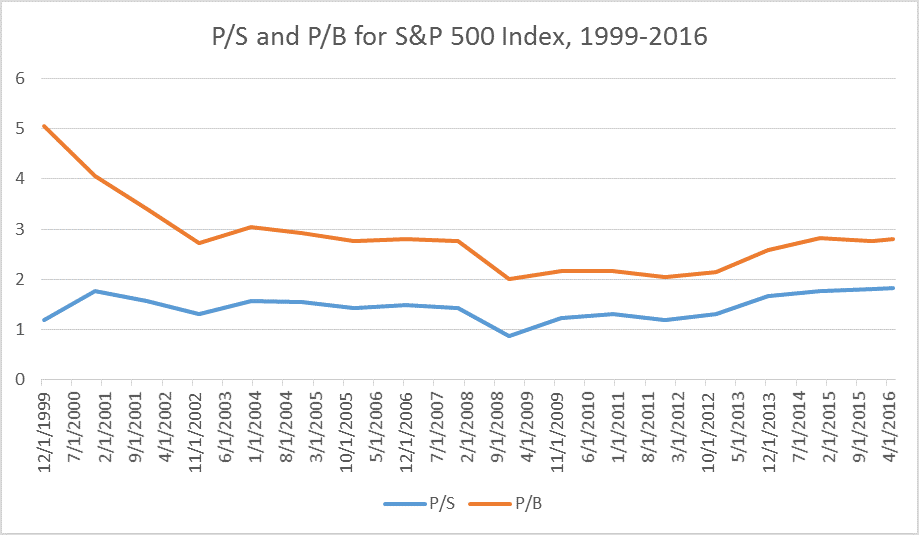
Figure 5 – Historical P/S and P/B for S&P 500 Index from 1999 to 2016. (Data source: multpl.com)
In light of the current low interest rates and availability of capital at historical low cost, companies may continue to borrow funds to pay dividends and repurchase shares. However, if the current credit expansion is disrupted as the Fed continues to increase the interest rates, companies may have a hard time to repurchase stocks for further price surge. This in turn, poses more risk to the stock market. In other words, investing in the stock market poses asymmetric risk to investors. Therefore, it may be the time to consider investing in stocks rather than stocks market.
Disclaimer
Dr. Ned Gandevani is a graduate finance professor at Harvard University and New England College of Business. He is a published author with four books and many articles and essays in investment, finance, business, investment psychology, and accounting topics. He could be reached at drng@nmgcapitalgroup.com or 617-910-6256.
Dr. Ned Gandevani is an Investment Advisor Representative (IAR) of NMG Capital Group, Inc. 101 Arch Street, Suite 1950, Boston, MA 02110. Securities products/services and advisory services are offered through NMG Capital Group, Inc., a registered investment advisor, 1-617-910-6256. This article is for general education purposes only and does not, nor is it intended to constitute legal, tax, investment, or financial advice. Please consult with your attorney, accountant and/or tax advisor concerning your particular circumstances.